Dashboard
Public Portfolio
Description
Each user will be assigned one Public Portfolio that will represent an individual’s standing on the seasonal leaderboard. Public Portfolios will be given $10,000 and full access to the trading market. The portfolio’s percent return will determine the user’s standing throughout the seasonal period. Upon the end of the season, the Public Portfolio will be reset and Prizes, Badges, and Tokens will be rewarded to the top investors. The Public Portfolio for each user and all of its assets are open to the community and any private trading should be done in a newly created portfolio.
Disclaimer
The functionality for viewing other user's Public Portfolios has not been implemented yet and is being worked on at the moment.
Quick Read
Public Portfolios start with $10,000 at the beginning of every season
All trades within this portfolio are open to the community
The portfolio is reset at the end of a season and prizes are distributed
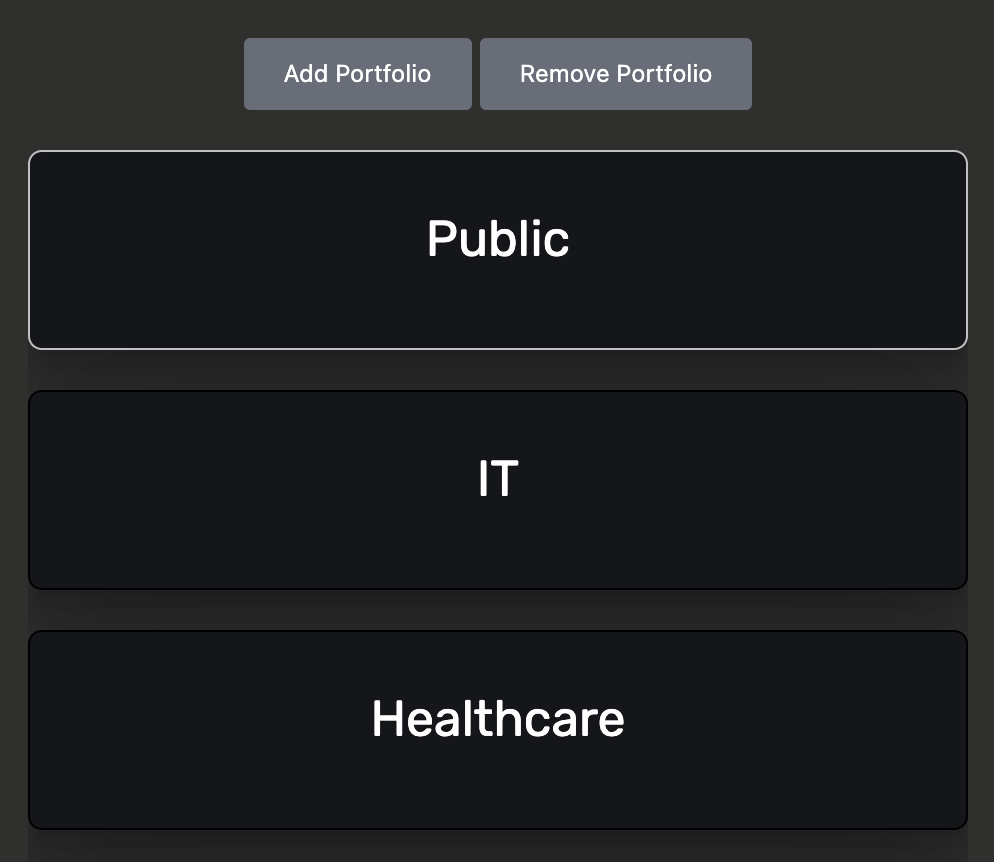
Managing Portfolios
Description
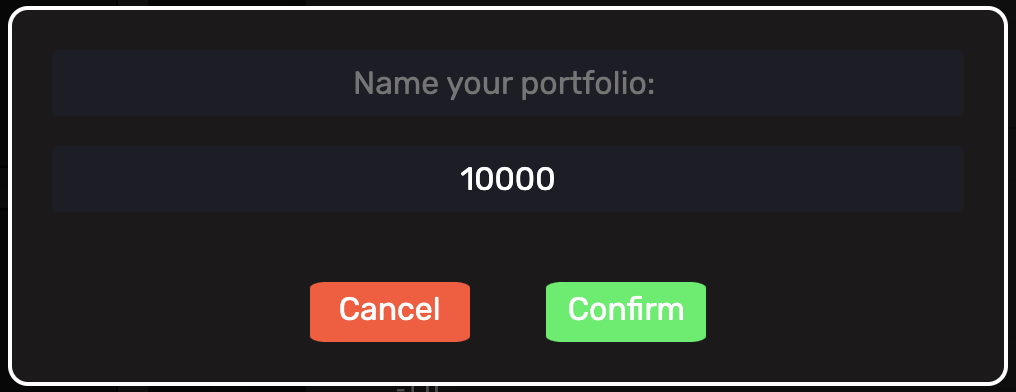
Users are able to create and delete portfolios using the buttons displayed in the Portfolios section. We allow users to decide their own portfolio name as well as an initial buying power given a range of $0 - $100,000. Users are able to create up to 8 private portfolios with full access to the trading market.
Disclaimer
Portfolios cannot be renamed yet so choose your names carefully. Also, the Public Portfolio cannot be deleted.
Quick Read
Users can create and delete private portfolios with custom names
Portfolios have a maximum initial amount of $100,000
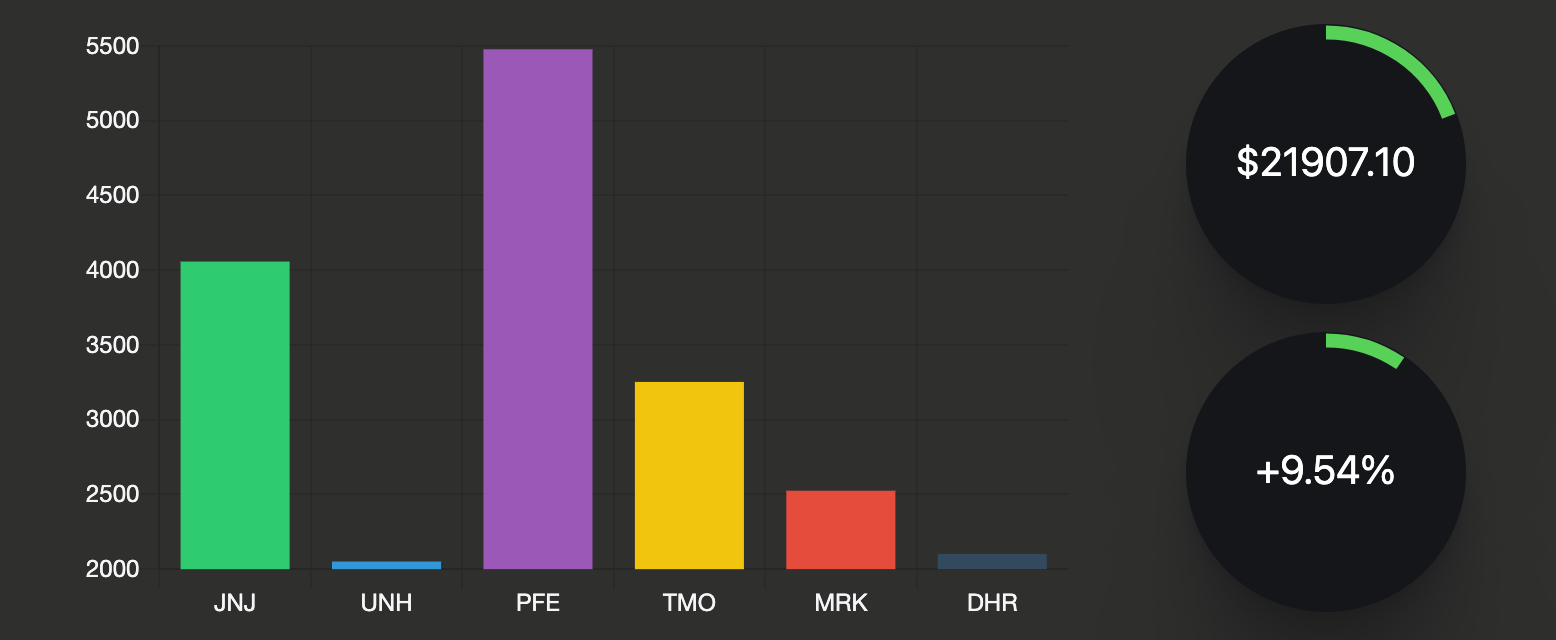
Portfolio Overview
Description
By hovering over their respective portfolios, investors are able to view a quick summary of their progress. The overview consists of a portfolio’s breakdown of its trading assets along with its total value and percent return. The bar chart shows a distribution of all of the stocks owned in the portfolio in relation to each other. The circular bar around the Total Value represents the goal of the portfolio which is preset to a 50% increase from the initial buying power. The circular bar around the Percent Return is directly related to the displayed value.
Quick Read
Displays a bar chart of the portfolio's asset breakdown
Visual of the Total Value of the portfolio and its progress to a 50% increase
Visual of the portfolio's overall Percent Return
Portfolio Analytics
Description
We provide in-depth analytics along with a trading summary of each individual portfolio. Users are able to access this page by clicking any of their portfolios on the Dashboard. More information about this page is provided in the Portfolio Details section.
Quick Read
In-depth analytics of a portfolio along with its trading summary
For more information see Portfolio Details
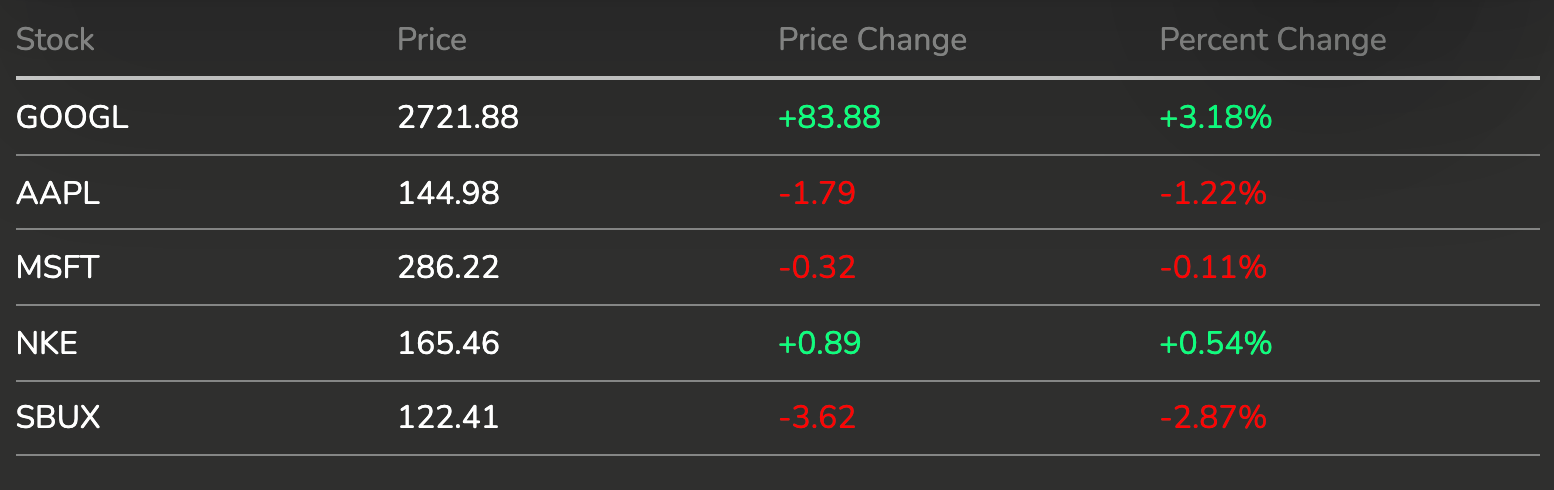
Watchlist
Description
The watchlist provides users with a livetime display of their chosen trading assets. Users are able to view an asset’s price, price change, and percent change while they constantly update with real time data. The stocks listed under the watchlist can be controlled by adding or removing them through the Marketplace. For more information see Managing Watchlist.
Disclaimer
Stocks added to the Watchlist are not a part of any portfolio and are only meant to allow users to quickly assess the current status of a stock without having to search them up in the Marketplace.
Quick Read
Lists the price, price change, and percent change of a user's chosen assets
For more information see Managing Watchlist
Market Data
Description
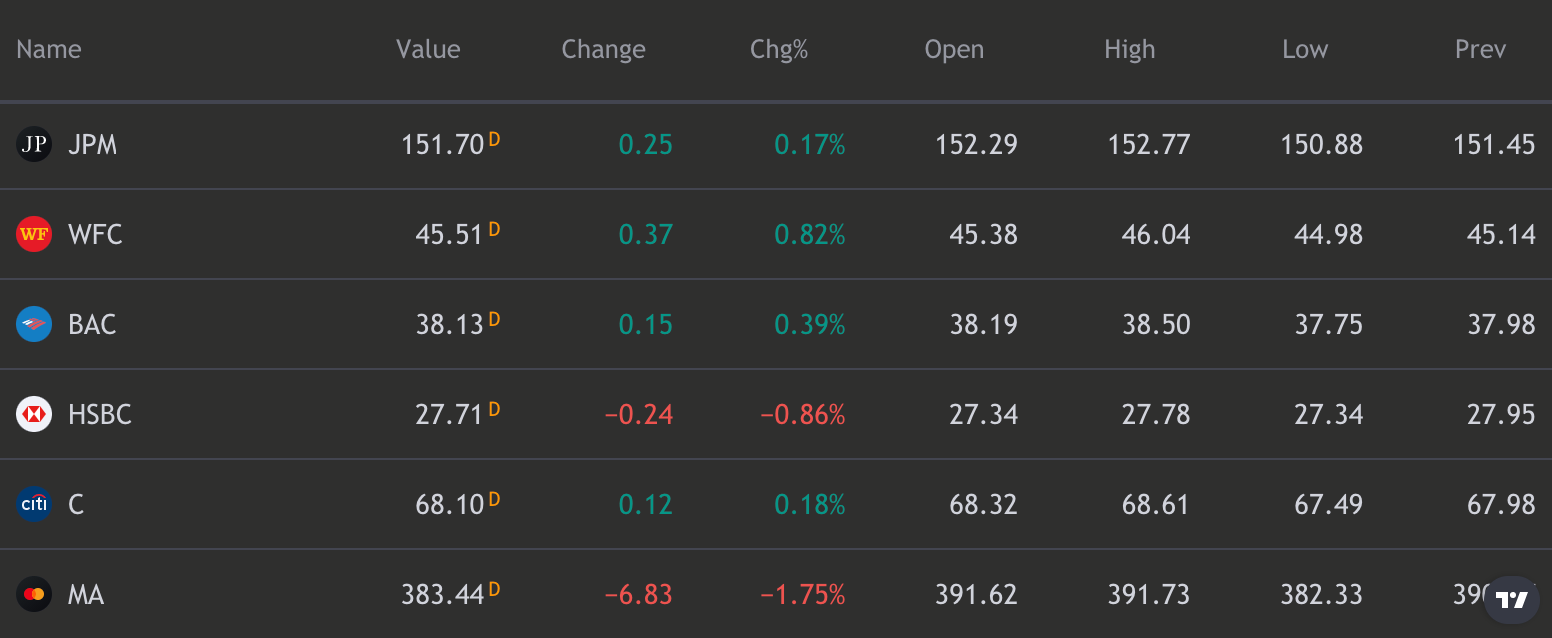
The Market Data widget displays numerous popular stocks for a variety of sectors. Users can keep up-to-date with the most sought-after stocks and use the provided Market Data as inspiration for assets to consider investing in. Current values, price changes, as well as daily market prices are all displayed for each asset.
Disclaimer
This widget and its data are provided by TradingView.
Quick Read
Market Data showcases a selection of popular stocks across different sectors
Portfolio Details
Stats/Distributions
Description
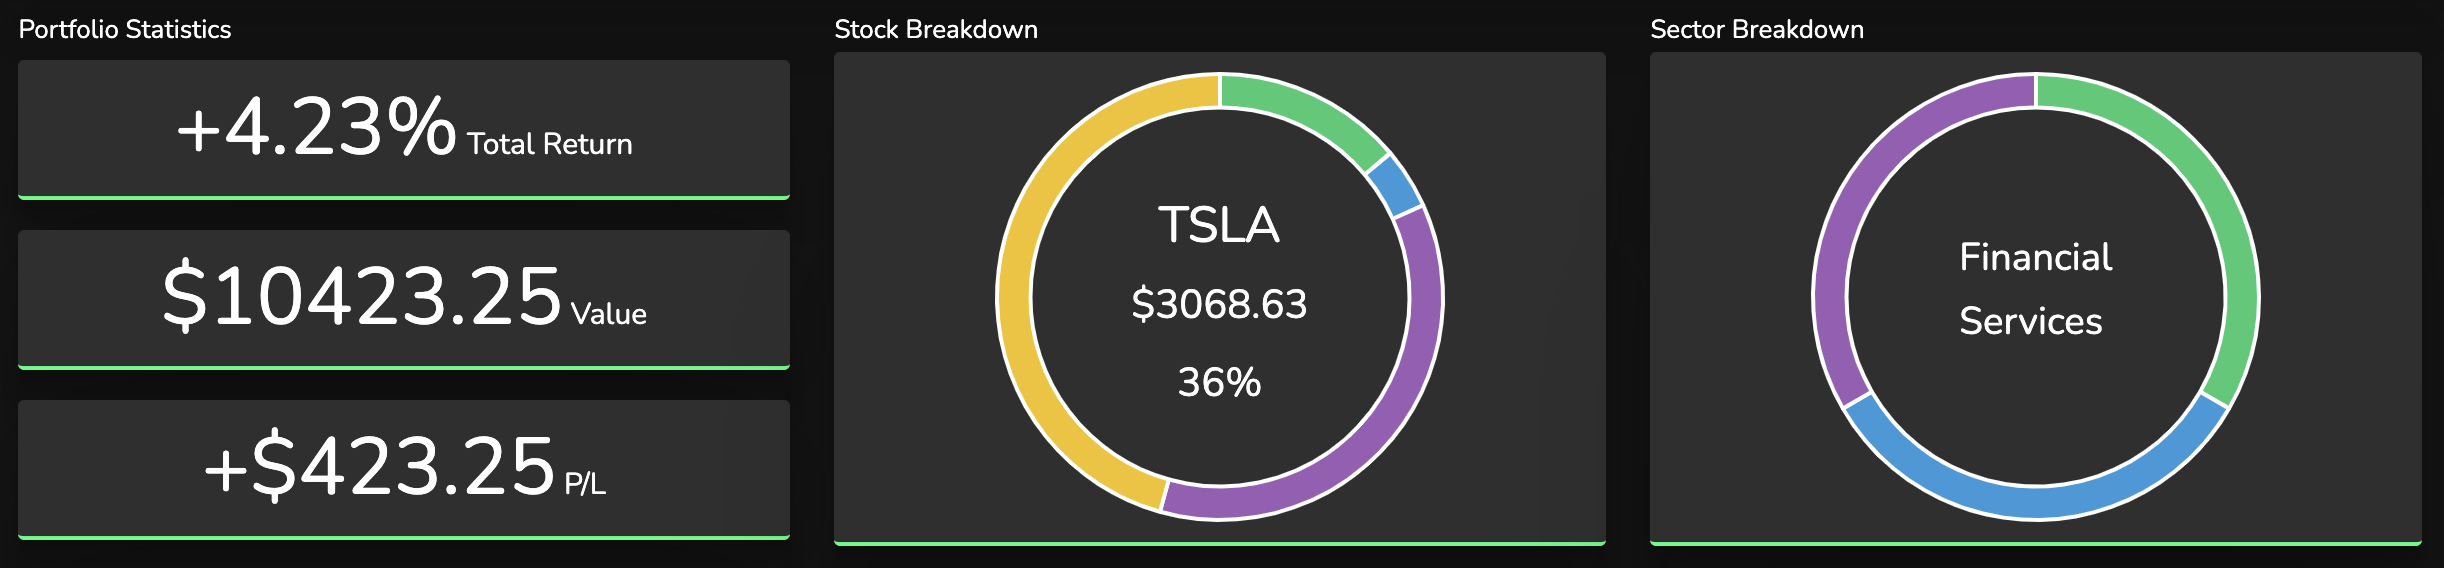
The portfolio's statistics and distributions are conveniently displayed to provide the user with an overview of their portfolio and its overall performance. The portfolio's Percent Return, Total Value, and P/L are listed under the Portfolio Statistics section. Each of these values update in real time during a market day, with a timer indicating when the next data refresh will be. To the right of this section are the Stock Breakdown and Sector Breakdown sections. Each of these breakdowns show the portfolio distributions of assets and industries in a pie chart. The Stock Breakdown also displays the amount of stock in the portfolio as a dollar amount and as a percent. The trim under the cards is either green or red to represent a positive or negative change.
Disclaimer
The Next Refresh countdown timer displays the amount of time until the next data update occurs but will not always immediately change the values displayed given the stock values may not have changed yet.
Quick Read
Portfolio Statistics, Stock Breakdown, Sector Breakdown display overview of portfolio
Percent Return, Total Value, and P/L listed under Portfolio Statistics
Trim under cards represents positive or negative change
Assets
Description
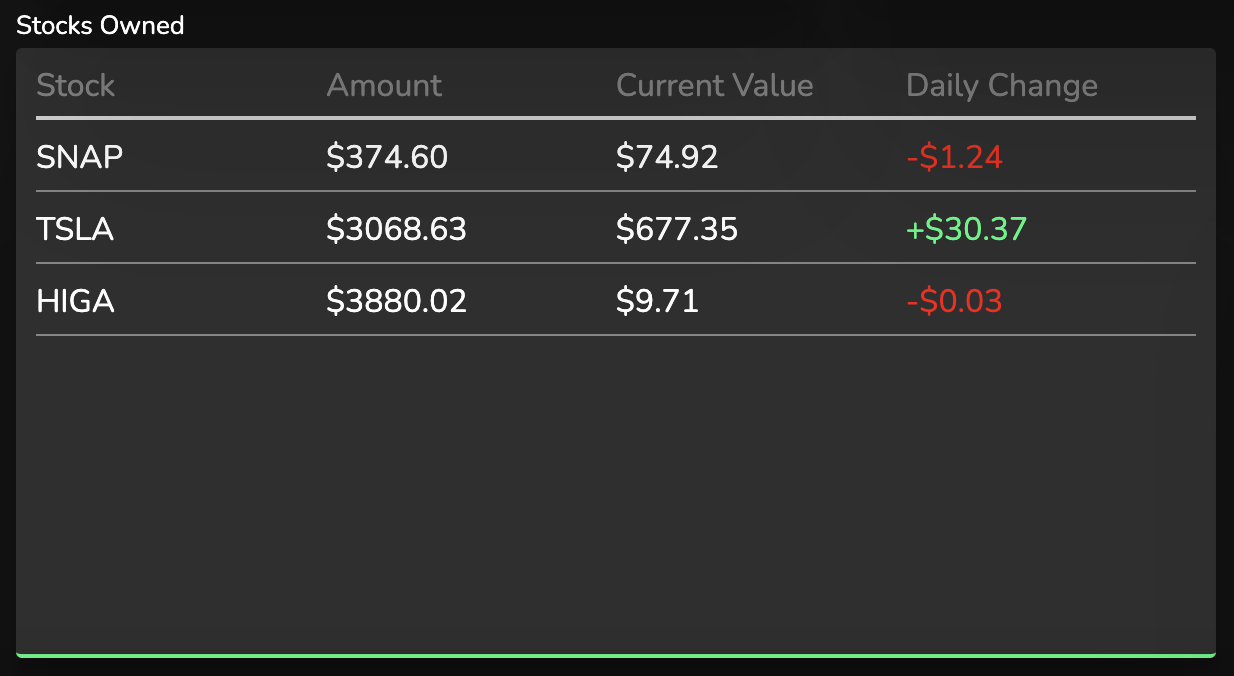
The Stocks Owned table displays all of the currently owned assets in the portfolio. Along with the stocks owned, the amount of each is shown as well as their current values and daily changes in dollars and percent.
Quick Read
Table displays all owned assets in portfolio
Listed for each stock is the amount owned, current value, and daily changes
History
Description
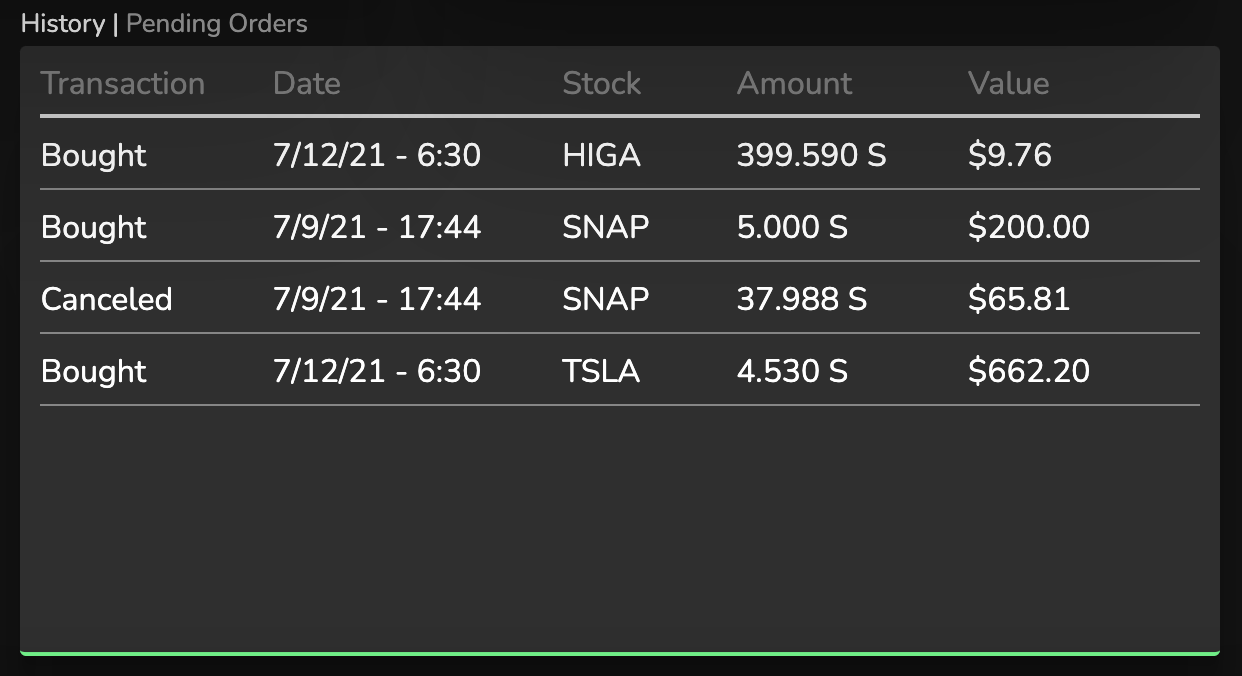
The History table displays a complete history of every transaction ever made for the portfolio. This not only includes Buys and Sells for all assets, but also successful Pending Orders as well as Canceled and Failed orders. The table provides information about when the transaction was made as well as the amount and value of the stock in the trade.
Disclaimer
The Next Refresh countdown timer displays the amount of time until the next data update occurs but will not always immediately change the values displayed given the stock values may not have changed yet.
Quick Read
Table displays all transactions ever made
Provides time of transaction as well as amount and value of stock
Pending Orders
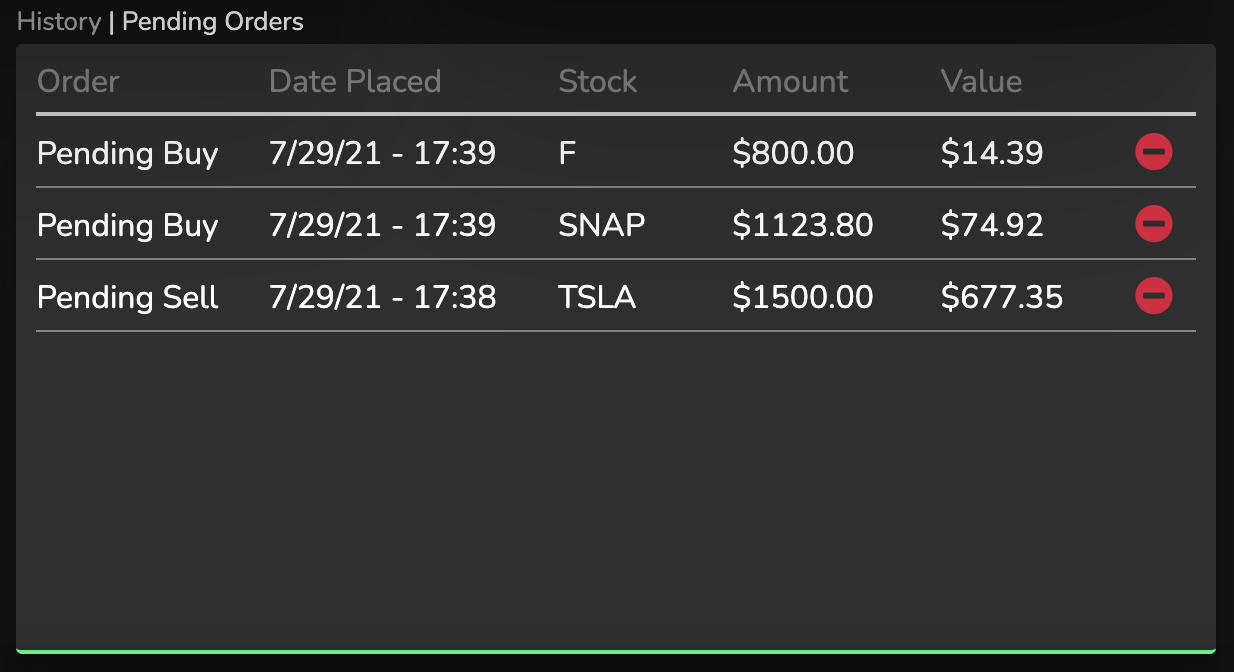
Description
The Pending Orders table displays any trade that was made after hours and became a Pending Order. The table provides the stock of the Pending Order, the amount of the transaction, and the value at the time the trade was made. Additionally, you can cancel a Pending Order by clicking on the (ー) icon.
Disclaimer
For more details on Pending Orders, see the corresponding subsection under Marketplace.
Quick Read
Table displays all Pending Orders for the portfolio
Listed for each Pending Order is the stock, amount of the transaction, and value at the time of the trade
Pending Orders can be canceled
Lifetime Graph COMING SOON
Marketplace
Stock Search Bar
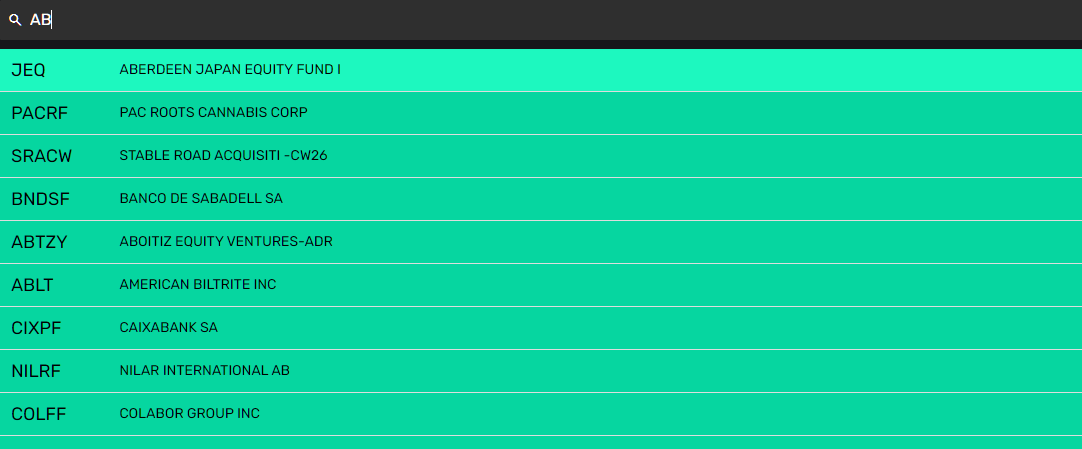
Description
Users are able to search for any of our supported assets through our search bar. Assets can be searched through company names as well as symbols, which will be displayed in the search result dropdown that changes as you search for a stock. The search bar is also accessible on the Navigation Bar at the top of the page, but only supports stock symbols and does not have a search result dropdown.
Disclaimer
If a stock is not appearing in the search result dropdown, contact us at myntsimulator@gmail.com or through the feedback form on the home page. This may be due to a stock being extremely new after IPO as our data stems from the APIs we use which may not have been updated yet.
Quick Read
Search by stock symbols
Search by company names
Located in Marketplace and in the Navigation Bar
Market Overview
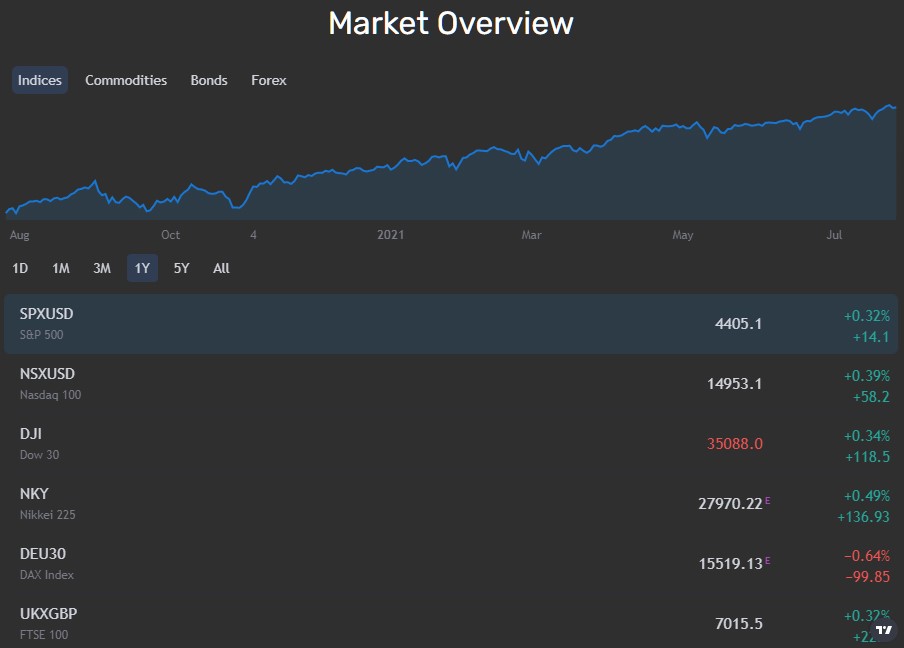
Description
The Market Overview widget gives users a quick overview of the latest market activity across various sectors. This widget displays the most common Indices, Commodities, Bonds, and Forex data active in the markets right now. Each asset has a corresponding graph that can be changed to view the asset's growth within various time frames ranging from one day to its entire lifespan.
Disclaimer
This widget and its data are provided by TradingView.
Quick Read
The Market Overview is an overview of the latest market activity across various sectors
Performance Watchlist
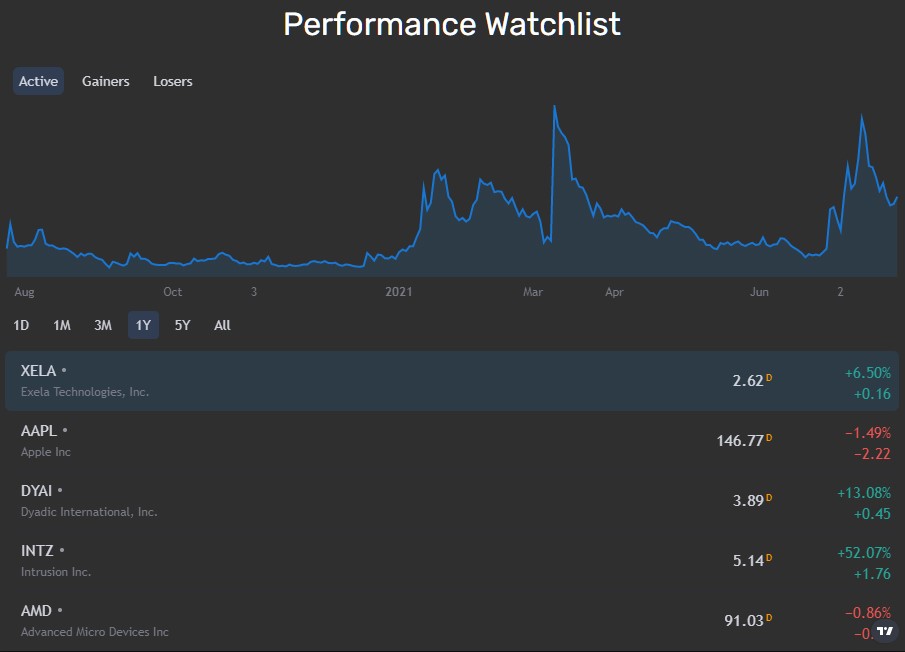
Description
The Performance Watchlist widget displays the top five most active stocks along with the top five gainers and losers for the day. The stock market data is updated daily to show the most accurate results for each category. Similar to the assets in the Market Overview, each stock is paired with its specific graph that shows the stock's lifetime growth. Gainers are stocks that had a large positive change while losers are stocks that had a large negative change.
Disclaimer
This widget and its data are provided by TradingView.
Quick Read
The Performance Watchlist displays the top five most active stocks, gainers, and losers
Stock Summary
Description
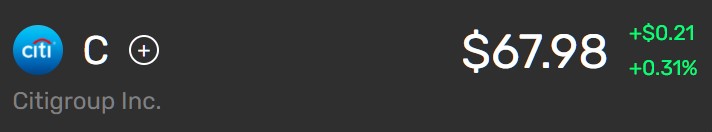
The Stock Summary card allows users to quickly assess the value of a stock and its daily change in both price and percent. The stock ticker is placed next to an image of the company logo and can be added to or removed from the Watchlist with the appropriate icon to its right. The full company name is located under the ticker symbol. On the right hand side of the card is the stock's current price, which updates in realtime during market hours. The stock's daily change is shown next to its value in either green or red to indicate the positive or negative change of the stock.
Disclaimer
The information on this card is provided by Finnhub API.
Quick Read
The stock ticker, company name, and company logo is displayed
The stock's current price and daily change in price and percent is shown in either green or red
Buy/Sell Card
Description
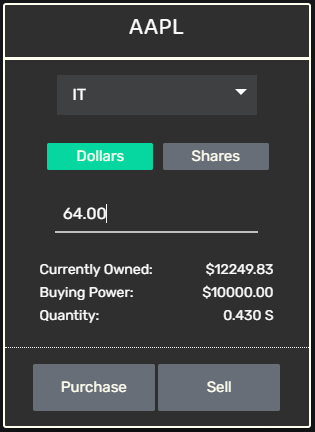
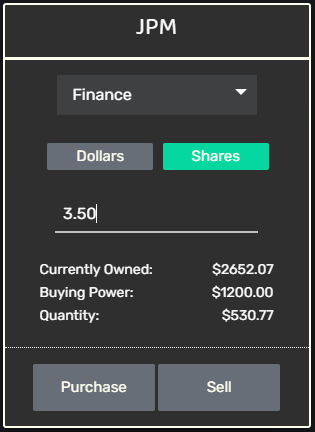
Users are able to purchase and sell assets for their portfolios through the Buy/Sell Card. After selecting their desired portfolio, users can continue with their transaction of the stock through either a purchase in dollars or shares. Under the area to enter the amount for the transaction are three pieces of information relating to the selected portfolio and stock. The Currently Owned section displays the amount of the searched stock owned in the selected portfolio. The Buying Power section shows the amount of cash present in the portfolio and updates in real time with every transaction. The Quantity section provides an estimated value of the other transaction type in dollars ($) or shares (S) as the user enters a trade amount. Once all the appropriate information has been entered, the user can either purchase or sell the stock with the two buttons at the bottom of the Buy/Sell Card.
Disclaimer
The transaction will only go through if it is actually possible to make such a transaction with the selected portfolio and amount entered. Alerts will be displayed if the transaction did not go through as well as if it was successfully completed.
Quick Read
Choose any portfolio from the dropdown
Specify amount in either dollars or shares for the transaction
Additional information about the stock and selected portfolio is provided
Pending Orders
Description
Pending orders take place during the after hours of the stock trading market. The stock market is open Monday through Friday from 9:30 AM EST to 4:00 PM EST. Any trade that takes place outside of this time period will go through as pending orders. For a pending buy, the portfolio’s buying power will be reduced based on the transaction amount. On the next market day, if the stock opens at a price equal or less than the transaction price, the trade will go through. If the stock opens at an amount greater than the transaction price, the status of the pending buy will change to Failed Order. For a pending sell, the portfolio’s buying power will remain unchanged until the trade goes through. If the stock opens at a price equal to or greater than the transaction price, the trade will go through and buying power will be updated. If the stock opens at a price less than the transaction price, the status of the pending sell will change to Failed Order.
Quick Read
Pending Orders are placed when a trade is made outside of market hours
Pending buys reduce the portfolio's Buying Power by the transaction amount
A pending buy succeeds if the stock opens at a price equal or less than the transaction price
Pending sells do not affect the portfolio's Buying Power
A pending sell succeeds if the stock opens at a price equal to or greater than the transaction price
Pending Orders that do not go through are documented as Failed Orders
Managing Watchlist
Description
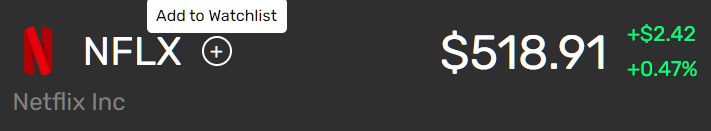
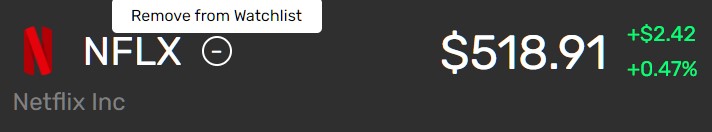
After searching for an asset through the search bar, users are able to add the asset to their Watchlist by clicking on the + icon next to the stock ticker. Once clicked, the asset is listed in the Watchlist table on the Dashboard. Similarly, to remove an asset from the Watchlist, users can click on the ー icon next to the stock ticker in the Marketplace.
Disclaimer
Stocks added to the Watchlist are not a part of any portfolio and are only meant to allow users to quickly assess the current status of a stock without having to search them up in the Marketplace.
Quick Read
Stocks can be added (+) or removed (ー) from the Watchlist through the Marketplace
Interactive Graph
Description
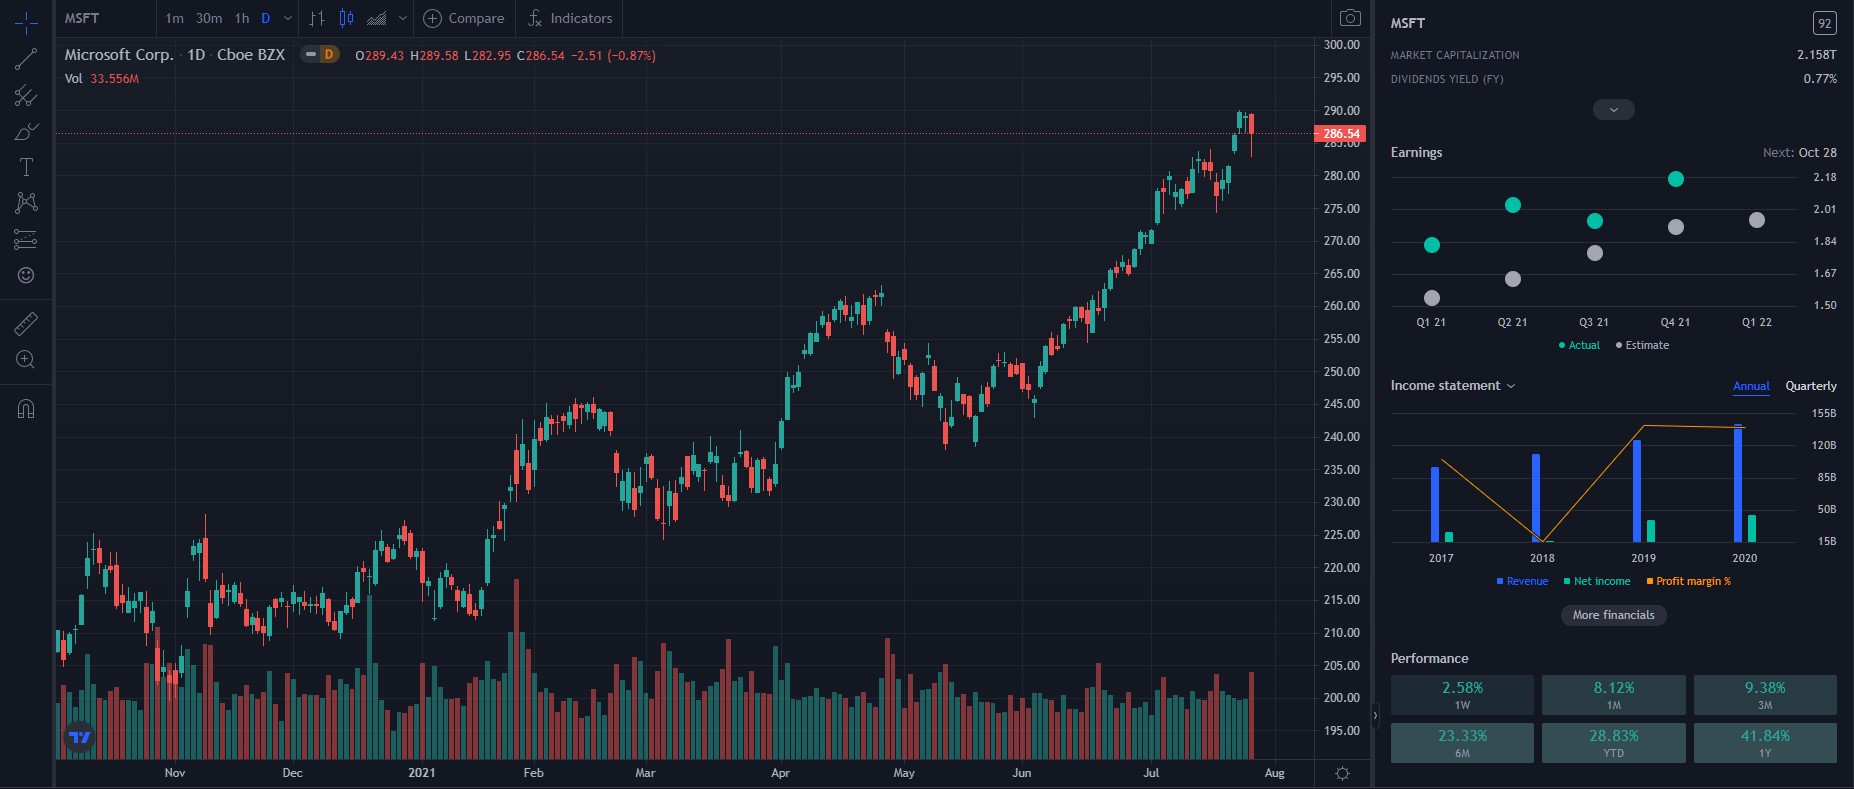
The Interactive Graph is a complex analytical tool to study trends in a stock's graph with many additional perks available to use. Users can explore the various functionalities the Interactive Graph offers by clicking Expand Graph under the basic graph displayed for the searched stock. This will take the user to a full page display of the graph with many more features where the user can analyze the graph in depth and predict future prices of the stock.
Disclaimer
Any edits made to the graph in the user's analytical process are not saved to the user's account and the tab must be kept open in order to preserve those changes. This widget and its data are provided by TradingView.
Quick Read
Use various analytical tools to study trends in stock graphs and predict future prices
Company Data
Description
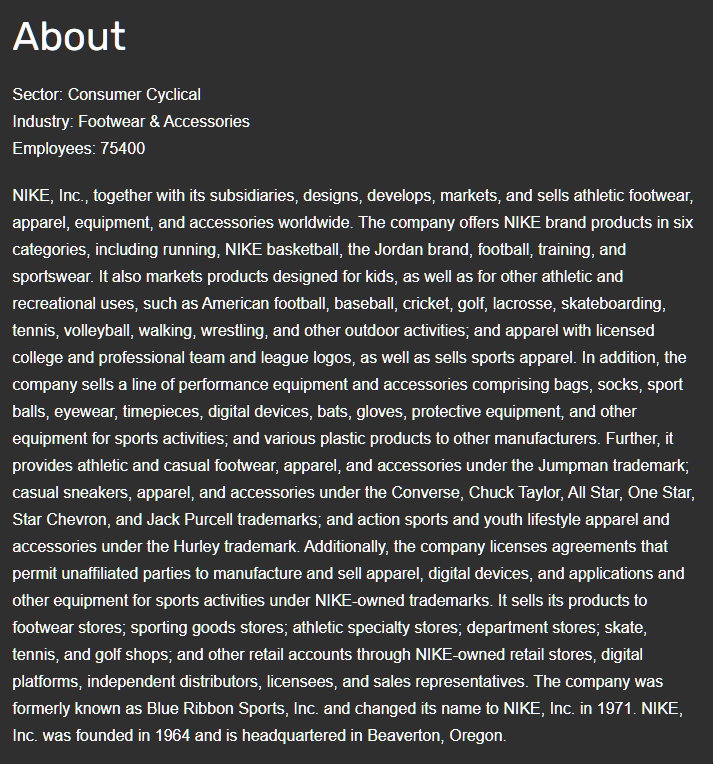
Our Company Data provides useful information about the company behind the stock. Users are able to view an overview of the asset or company through the About section below the interactive graph. The sector, industry, and number of employees working at the company is listed before a brief synopsis of what the company does. This data gives the user a better idea of the company's focus and success, which can then be used in their decision to purchase or sell the company's stock.
Quick Read
Sector, Industry, and Number of Employees is listed
Brief synopsis of the company's focus is provided
Technical Analysis
Description
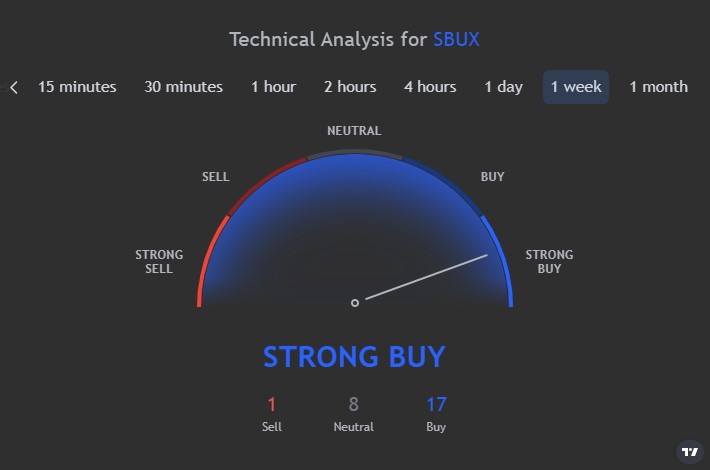
The Technical Analysis widget is an advanced tool that displays ratings based on technical indicators. Users no longer have to apply multiple indicators to analyze a financial instrument since the widget does that for you. Additionally, all ratings are shown in real time, providing users with the most accurate financial analysis at all times. The widget suggests an ideal trade for the specific stock considering various intervals of time.
Disclaimer
This widget displays a rough estimate of the best trade decision and is in no way Mynt's financial advice and should not be taken as such. This widget and its data are provided by TradingView.
Quick Read
The Technical Analysis is a high-end tool that predicts the best trade for a stock
Stock Financials
Description
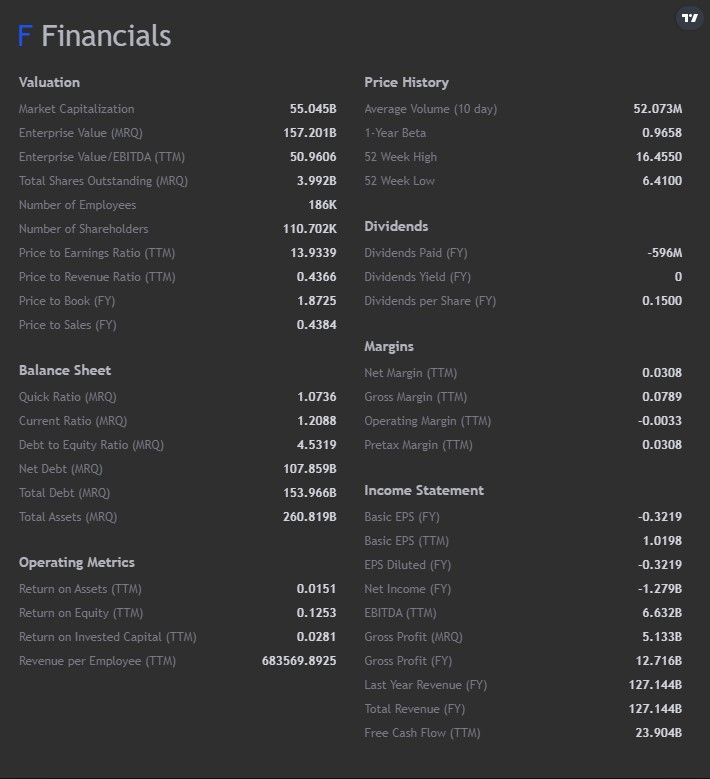
The Stock Financials widget provides a large collection of fundamental data for the specific company. This data allows users to further understand how the company is performing beyond simple stock price information, giving them more insight into what decision to make when purchasing or selling the stock.
Disclaimer
This widget and its data are provided by TradingView.
Quick Read
Stock Financials provides fundamental data for a company beyond its stock price
Multi View COMING SOON
Stock Pop Up COMING SOON
Competitive
Public Tournaments COMING SOON
Private Tournaments COMING SOON
Classroom COMING SOON
Sponsored Contests COMING SOON
Featured Contests COMING SOON
Competitive COMING SOON
Hypercompetitive COMING SOON
Champions COMING SOON
Account
Notifications
Description
The Notifications section of the Account page acts as an inbox that details your activity on Mynt and provides useful information regarding the application. Notifications can come in forms of social updates, portfolio achievements, tournament information, general announcements, and more. Clicking on a Notifications marks it as read, and you can change the display to show all Notifications or only new ones. Updates and announcements from our team will also come in the form of Notifications.
Quick Read
Notifications act as an inbox that details your activity on Mynt
In the form of social updates, portfolio achievements, tournament information, general announcements, and more
Mark as Read by clicking on the Notification
Tokens and Badges
Description
Badges are earned through portfolio accomplishments, tournament placings, general achievements, and other user activity based feats. A short description of how to unlock a specific badge is detailed under each badge in the corresponding section on the Account home page. Additionally, there are Easter Egg badges that have no description and can only be unlocked in specific ways for the user to find out. Divided into levels, each badge rewards the user a certain amount of Tokens based on the type of badge unlocked. Tokens allow users to enter into high-level Tournaments in which the top investors are rewarded with more Tokens or a cash prize, depending on the Tournament. Tokens will also be used in other aspects of the application which are soon to come.
Disclaimer
Tournaments have not been implemented yet and are currently being worked on by our team. Users will be able to use their Tokens once the Competitive Update is pushed.
Quick Read
Badges are earned through feats such as portfolio accomplishments, tournament placings, general achievements, and more
There are different levels of badges with a ranging Token reward
Tokens will soon be used to enter into high-level Tournaments
Mining Tokens
Description
Everyday, users are able to click on the Mine Token button and redeem their daily reward of 5 Tokens. This reward is only redeemable once per day and does not stack based on the number of days that have passed, meaning the reward will always be 5 Tokens regardless of how long it has been since the user last mined tokens.
Quick Read
Users can redeem 5 Tokens once a day using the Mine Token button
Referral Link
Description
Clicking on the Copy Referral Link button copies the user-specific referral link to the user's clipboard which can then be sent to the user's peers. If someone registers an account for Mynt using the user's Referral Link, both the user and the person who used their Referral Link will get 5 Tokens and will automatically be added as each other's Friend. See the Friends section for more information.
Quick Read
Someone registering their account using your Referral Link automatically adds them as your Friend and rewards both users with 5 Tokens
See the Friends section for more information
Friends
Description
Under the Social section, you can search for users in the search bar and Request them as a Friend. The search result will be outlined in green if the user exists and in red if the user does not exist. Confirmed Friends will show up under the Friends table. Users who have sent a Friend Request to you will show up under the Requests table. Users whom you have sent a Friend Request to will show up under the Pending Table.
Disclaimer
If a user is not showing up in the search results, try logging out and logging back in, this may be due to the new user having just registered an account.
Quick Read
Users can search for other users in the Social section to add them as a Friend
Friends are split into three categories: Confirmed Friends, Friend Requests, and Pending Friends
Account Settings
Description
Account Settings are currently being worked on to have more functionality but will offer users to be able to link their other social media profiles to allow for a more connected community once Social Profiles become available.
Quick Read
This section is currently being worked on but will soon allow users to connect their other social medias
External APIs
 TradingView
 Finnhub
 Financial Modeling Prep
 Tiingo
Other Credit
About
Overview
Mynt Simulator is a free platform that allows users to practice investing in the real time stock market with no risk involved. Learn how to manage your personal stock portfolio, analyze stock graphs, and connect with other growing investors. Mynt encourages beginners to freely experiment in the market without worry and gain valuable insight into the trading world.
Fundamentals
Mynt gets its stock market data from external APIs to simulate a real time trading environment. These values are displayed on our site to be representative of the real stock market, but do not hold any actual value. Currently, all forms of currency depicted in this application are virtual and are solely intended to be used for learning purposes. The money displayed in your portfolios and for each stock is not real and does not have any value beyond Mynt Simulator.
Contact Us
You can reach out to us at myntsimulator@gmail.com for any questions or suggestions.